Statistics on the Scale of Japanese Packaging Industry in 2020
* including estimation value By Japan Packaging Institute
- Value -
| A) Shipment value of packaging materials and containers | ¥ 5,562 bil. (yen) |
| Previous year: ¥ 5,751 bil. (yen) | |
| Ratio to the previous year: 96.7 % | |
| B) Production value of packaging machinery | ¥ 516 bil. (yen) |
| Previous year: ¥ 526 bil. (yen) | |
| Ratio to the previous year: 98.3 % | |
| Total ( A + B ) | ¥ 6,078 bil. (yen) |
| Previous year: ¥ 6,277 bil. (yen) | |
| Ratio to the previous year: 96.8 % | |
- Volume -
| A) Shipment volume of packaging materials and containers | 18.50 mil. ton |
| Previous year: 19.07 mil. ton | |
| Ratio to the previous year: 97.0 % | |
| B) Production number of packaging machinery | 275,300 |
| Previous year: 279,600 | |
| Ratio to the previous year: 98.5 % | |
Table 1 The scale of Japanese packaging industry, 2016 - 2020
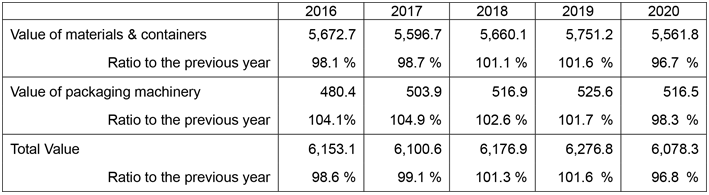 |
| * unit: billion yen * including estimation value in 2020 |
Table 2 A rate in scale of the Japanese packaging industry to the nominal GDP.
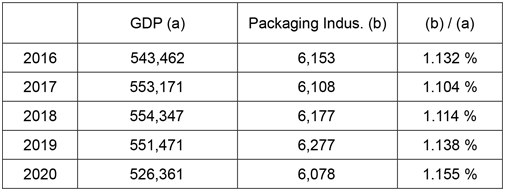 |
| * unit: billion yen * including estimation value in 2020 |
Table 3 Share of packaging materials in shipment value & volume in 2020
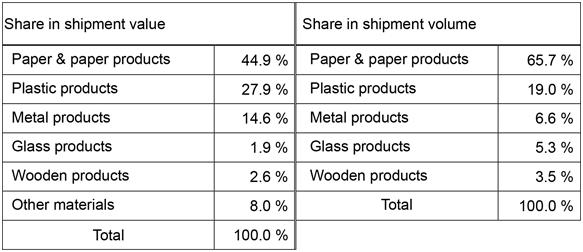 |
Table 4 Overview of shipment value of packaging materials and containers
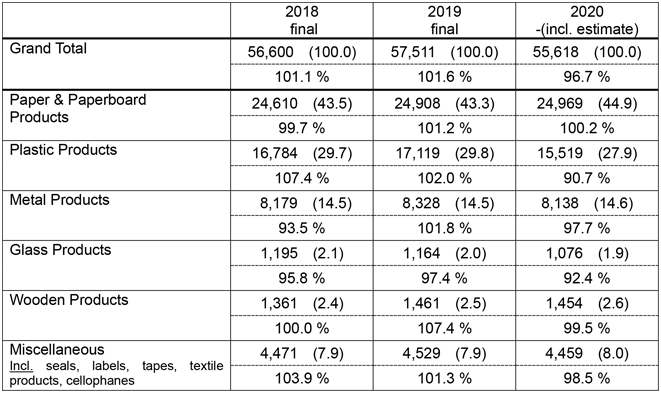 |
| Upper column: Shipment value in 100 million yen(¥) Figures in ( ) shows composed ratio - % Lower column: Comparison with previous year - % |
Table 5 Overview of shipment volume of packaging materials and containers
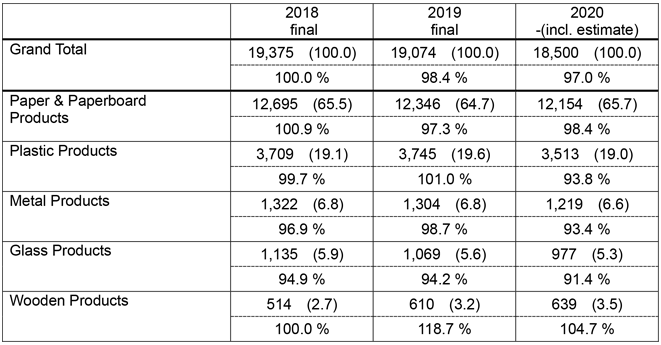 |
| Upper column: Shipment volume in 1000 tons Figures in ( ) shows composed ratio - % Lower column: Comparison with previous year - % |
Table 6 Overview of production number and value of packaging machinery
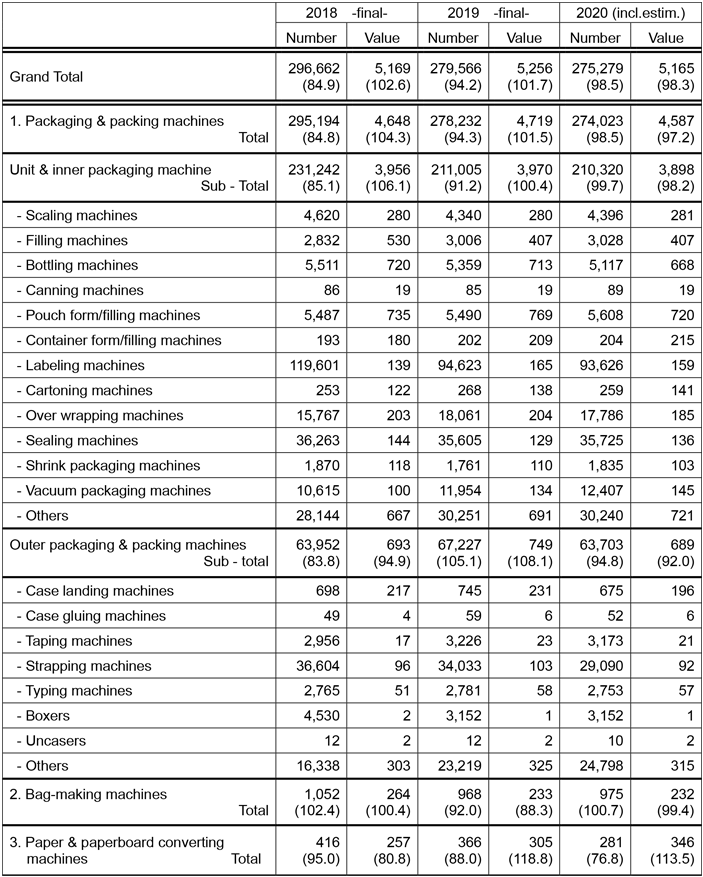 |
| Production value in 100 million yen(¥) ( ); Comparison with previous year % |