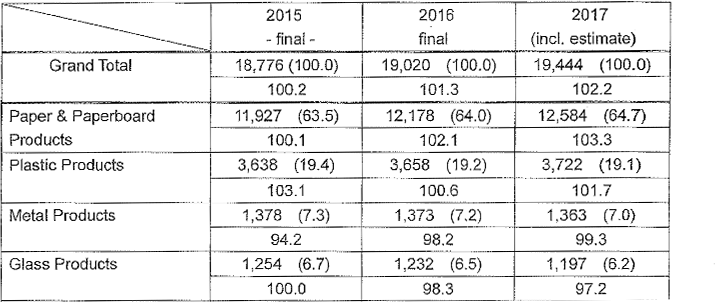
Statistics on the Scale of Japanese Packaging Industry in 2017
By Japan Packaging Institute
- Value -

- Volume -

Table 1 The scale of Japanese packaging industry, 2015- 2017
|
|
 |
|
|
Table 2 A rate in scale of the Japanese packaging industry to the nominal GDP.
* unit: billion yen |
 |
Table 3 Share of packaging materials in shipment value & volume in 2017

Table 4 Overview of shipment value of packaging materials and containers
|
||||
 |
Table 5 Overview of shipment volume of packaging materials and containers
|
||||
 |
Table 6 Overview of production number and value of packaging machinery
Production value in 100 million yen(¥) ( ); Comparison with previous year % |
 |