Changes of Lifestyle and Food Packaging
1ÅDDiverse lifestyles
Lifestyles are extremely diverse because views on life and values differ with each individual, and manners and customs differ with each country. In the face of rapid lifestyle changes, the product development of packed food is full of struggles; new items are being developed one after another and their packaging requires ingenuity. While people are rather conservative with respect to food and eating, new tastes and cooking methods have been filtering into their lives. To fully respond to these changes, packaging has been given new twists. Packaging is closely associated with the lifestyles of the time and country and, reflecting lifestyles, undergoes changes. Although packages shall be sensitive to lifestyle changes, due consideration is required for how to respond to value diversification and rapid changes.
2.Å@Advanced packaging machines
Just like the shape, size, weight and production quantity of packages are required to respond to lifestyle changes, filling and packaging machines are required to respond to package diversification. At Interpack 2014, a trade fair held in Germany, Bosch Packaging Technology and other machinery manufacturers are trying to respond to the changes at hand and to create changes. The main sales target is shifting from South-East Asia to India and the Middle East. The strategy of manufacturers is clear; they will sell ready-made machines and also work on planning/design of packaging lines tailored to client desires. The manufacturers intend to follow-up changes and move a step ahead of the market. Interpack 2014 is a place where we can seize the needs and seeds of the packaging industry to respond to the lifestyle changes in the world.
2-1 Flexibility and product safety
To respond to the changing market as soon as possible, a new filling and packaging machine has become available that can easily switch the packaging mode within minutes from household use to on-the-go use, which is also called the incremental mode. Japanese manufacturers also have addressed similar technology development, focusing on switching within minutes in a seamless manner.
Moreover, to avoid presenting customers with defects, inspection equipment has advanced. Training centers are placed so that operators can master filling/packaging machines, creating a high-performance packaging system. The machinery industry is also working to respond to lifestyle changes.
2-2 Consigned filling work
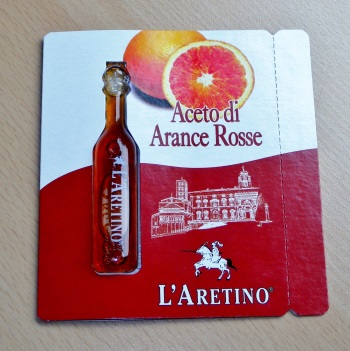
Some machinery manufacturers have extended their services from selling machines to handling filling work. In this age of change, clients cannot successively invest in facilities; consigned filling work is increasing. A medium sized European manufacturer enjoys significant benefits from this business model. Consigned filling is one option to respond to lifestyle changes and need diversification. (Photo 1)
Photo 1: Molded sheet created by consigned filling
As seen above, in response to lifestyle changes, the design and function of packages as well as the filling/packaging machines have changed.
3.Å@Contribution of packaging to saving food
Our rich and busy lives have resulted in an increased amount of wasted edible food without our realizing it. Concerned about this waste, active campaigns to reduce food loss have been on the way under the Save Food initiative. At interpack 2014, a Save Food conference was held and had many entries; packaging companies presented and displayed ideas and products for saving food. While offering convenience has become more and more important along with lifestyle changes, useless waste of packed foods must be reduced. In the conventional supply chain of foods, only packages convenient for selling and using have been sought. More weight should be attached to investigating to improve storage stability at home and to develop packed foods to be used up. Investigating packages that can contribute to saving food is progressing.
3-1 Forms and packages for providing food
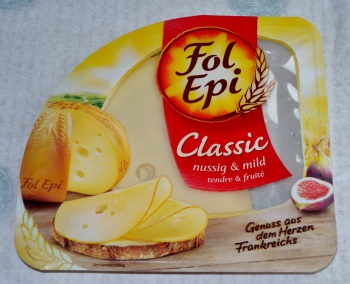
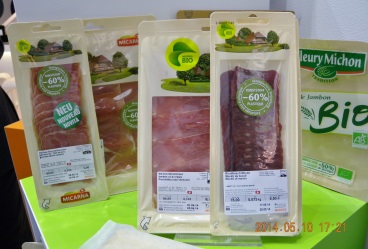
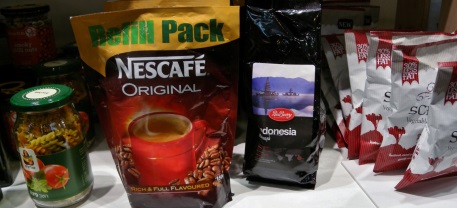
Due to the decrease in family size and the prevailing habit of eating alone, foodstuffs sold in sliced form, in small size packs or in portion packs such as cheese, ham and sausage have increased. This is problematic concerning the packaging material cost, but can reduce the amount of leftovers. Buying only the quantity needed and eating it up is important. Small-sized packs and portion packs are packaging forms corresponding to the present lifestyle changes. (Photo 2)
Photo 2Å@Sliced ham
3-2 MicVac
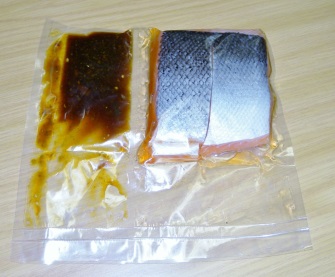
MicVac is cooked food developed in Sweden with refrigerated distribution. The technology has been introduced to Japan and put into practical use. At Interpack 2014, newer and retort-responsive types were presented. Existing technologies have shifted to the packages that better fit expected lifestyle changes. With respect to storage stability, MicVac can contribute more to saving food. (Photo 3)
Photo 3 Retort-responsive MicVac
4. Lifestyle changes and package examples
Food comes in many packages; major examples and their trends are seen below.
4-1 Convenience and microwave foods
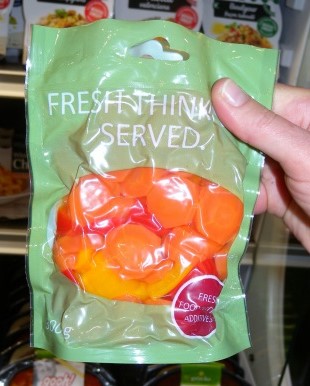
Pursuing ease and convenience, microwave foods will continue to increase. For combinations of microwave and preservation techniques, such as retort, aseptic filling, chilling and freezing, various packaging forms have been used. Although existing cooked meals will remain, new types to be cooked with a microwave oven before eating have been proposed. These food articles are pursuing convenience, palatability and cost performance. (Photo 4)
In addition, microwave cooking foods combined with freshness-keeping techniques such as Variable Heating Steaming have been proposed.
Photo 4 Microwave foods by combining two liquids
4-2 Ease of opening and reclosability
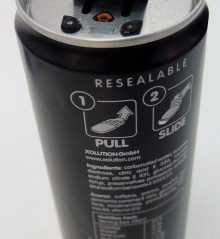
Ease of opening and reclosability are important for convenience and Japan has many techniques in this area. At Interpack 2014, Herrmann, Inc. presented a reclosable aluminum can. It has already been put into practical use; the reclosable plastic part is welded by an ultrasonic technique. (Photo 5)
Aluminum cans, in the form of bottle cans, can be recapped, enabling soda and juice cans to be reclosable, portable and convenient for temporary storage. It seems best suited for an on-the-go lifestyle.
A European company has put a zipper to practical use that can be resealed more easily than traditional zippers, which is one answer to the need for more convenient and reliable reclosability.
Photo 5 Herrmann soft drink
4-3 Filling and packaging machine using impulse sealing
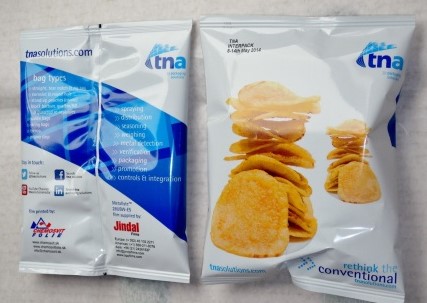
Cut vegetables have become universally popular. Statistical data of Japanese dietary habits, comparing between 2008 and 1965, show that consumption of meat such as beef and pork has increased, while that of rice and vegetables has decreased. Cut vegetables enable consuming vegetables easily and will not produce waste: a good example of a response to lifestyle changes. For example, tna Europe Ltd. sells center-seal packaging machines that impulse-seal the monolayer film for cut vegetables longitudinally and transversely and delivers a good number to Korea and the U.S.A. (Photo 6)
Pouches undergo changes with those in lifestyle, packaging material and packaging/filling machines. Moreover, the antifog additives of packaging material are shifting from Ågkneading into resinÅh to ÅgcoatingÅh.
Photo 6Å@Impulse-sealed pouch
4-4 Increase of cooked food and corresponding packages
According to ÅgFamily Life seen in Household AccountsÅh by the Statistics Bureau of Ministry of Internal Affairs, the expenditure for cooked meals and eating-out in 2010 has almost doubled since 1965, resulting in an increase of packed MREs (meals ready to eat) and packages for industrial use. In convenience stores, boiled or retort foods in stand up pouches have increased. Among MREs sold in department stores, those with long shelf lives will increase. Enhanced dependency of foods and meals on the outside will require ingenuity in packages in many aspects, such as suitability for take-out, ease of use and keeping-, rewarming- and on-the-table properties. Since the demand for nursing care diets has increased, the development of easy-to-use packages for care givers is also hoped for.
4-5 Response to two- and three dimensions including Augmented Reality
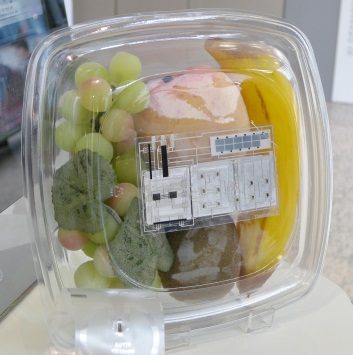
A growing number of people do not use textual or visual information on the surface of packages. Some people may know how to use the packed food, but others may simply guess. Under the circumstances, food tends to be wasted and accidents due to human error occur at a higher rate. Recently, response to invisible information has become necessary, and its application to the field of food and medicine is being evaluated. The response to interactive package design will become widespread. The number of items to be labelled has increased and the surface area of packages can no longer contain them all. Providing more information by using mobile terminals will grow popular. Application of RFID (radio frequency identifier) by using NFC (near field communication) and PE (printable electronics) are being aimed at around the world and in Japan. (Photo 7)
The surfaces of packages, interfacing with IT, play an important role in providing information.
Photo 7 Proposed package with a sensing function by using PE
5. Projected future
With lifestyle changes, food packaging will require, in addition to technical advancement, more attention attached to emotional aspects. We are waiting for catchy, warming and delightful packages that arouse consumer interest and help them to avoid errors that make them feel bad . The design packaging process where judgment is always based on cost by looking for less expensive materials and systems is important. However, in order to respond to globalization, another design attitude is also necessary to aim for sustainable packaging that considers global resource conservation and appeals to consumer conscience and emotion. In addition to pursuing packaging material functions and user-friendliness, considering human needs for food safety and security will be as important as ever.
5-1 Resource conservation conscience
Response to sustainable packaging is steadily increasing. Consumers who prefer and purchase such packed products are also gradually increasing. The use of polymer as well as traditional paper and pulp will be promoted. New packaging material such as moldable paper trays and laminated paper/biopolymer will also penetrate the market by little and little. (Photo 8) Views on life and senses of value influence buying behavior.
Photo 8 Tight seal paper tray
5-2 Safety and reassurance
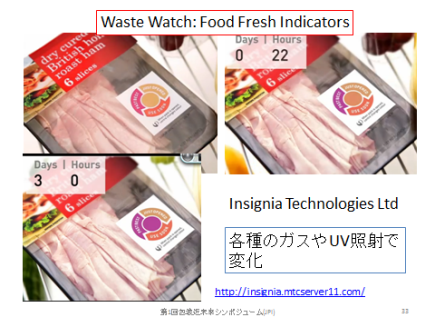
Indicating food additives and origin and expiration dates greatly influences purchases. In response, packaging technology has evolved and techniques calling-for-attention have progressed. For example, when a packed food is stale, the bar code will become unreadable at the checkout counter; the food fresh indicator color will change during storage (Photo 9); and the color will change according to the inside gas level detected by sensor. Packages that can store food for 5 years have already been put to practical use. The FDA emphasizes food safety; responding to the Food Safety Modernization Act (FSMA) will become important. Like medical products, individual item management will be required. Lifestyles seeking safety and reassurance will remain unchanged for years to come. Safety and reassurance should be secured throughout the life cycle of a product from obtaining the material to recycling. Future lifestyles will demand this.
Photo 9Å@Food fresh indicator
5-3Å@Small lot production and digital printing
To respond to lifestyle changes, the systems of food production and packaging material supply also change. As for the printing technology for providing information to people, digital printing has filtered into the systems in response to small lot production, quick delivery, fast marketing and better cost performance. The world penetration rate is estimated to be 7% and is expected to grow further. (Photo 10)
Photo 10 Soft packages printed by a digital printer of Hewlett Packard
5-4 Keeping fresh after opening
Keeping contents fresh after opening soy sauce or wine, for example, is one of the main challenges for the packaging industry. This will also apply to cosmetics and other products.
5-5 Preventing content adhesion
Packages minimizing content adhesion and enabling consuming and eating up the food have been put into practical use for container lids for sweets. In the United States, too, an up-to-date technology is proposed to prevent the food from adhering. This is a difficult theme but, in the atmosphere of reappraising the spirit of avoiding waste, will be demanded more.
5-6 Clarity
The graphic design of packages should be clear for busy consumers to be able to decide at a glance on store shelves. Since mail-order sales have been increasing as well, expression for that purpose is important to help accurate judgment of consumers at the points of purchase and use. The clarity of information on packages will be more and more important, including the text, character size, graphic design and proposals for how to use and additional data in two-dimensions.
Conclusion
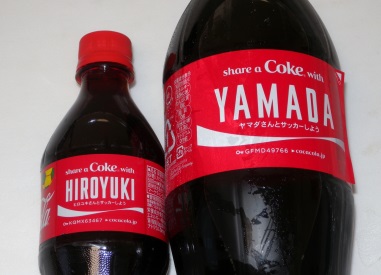
The key issues for packed foods will be the same as today, such as ease of repacking in small quantities, storage stability to ensure long life, instructions how to preserve leftovers after opening and packages easy to discard after using. Many people, particularly the elderly who have difficulty in shopping, present this new social problem with shopping in Japan. Aged persons who can fully use the Internet and obtain their daily necessaries by mail-order are few. Store locations, styles and packages should respond to this problem. Long selling products are continually changing their packages little by little. This demonstrates the necessity of changing packages along with lifestyle changes. (Photo 11)
Photo 11 Digital printed labels of PET bottles showing share with customer
Lifestyles, against peopleÅfs will, are influenced by the trends of the times. Lifestyles undergo changes with many turns and twists and create a new flow and, with this flow, packaging also changes. When a consumer is about to buy a packed food, the consumer will not select foods if the design of the package seems old and fails to keep pace with lifestyle changes. Today, Japanese meals are highly regarded around the world. We want to provide the world with Japanese foods in packages reminiscent of Japanese culture.
Reported by Mitsuhiro SUMIMOTO
Packaging Professional
Technical Advisor (Consumer Packaging), Japan Packaging Institute
Representative, SUMIMOTO Professional Engineer Office
Statistics on the Scale of Japanese Packaging Industry in 2013
Introduction
Each year the shipment statistics of JapanÅfs packaging industry of the previous year is featured in the June issue of the monthly ÅgPackaging TechnologyÅh published by the Japan Packaging Institute. And the information is put to widespread use in various sectors. In 2001, more than ten years ago, the JPI compiled a report giving detailed exposition on the status of packaging by packaging material.
This time, in compiling another report, we attempted to survey the changes in the packaging industry of this country along with the various changes in the social and economic environment over a ten year span. The initial years of the 2000s were the time the Japanese economy began to show signs of steady growth by finally recovering from the collapse of bubble economy. Then, however, came the global recession following the economic downturn triggered by the Lehman Brothers bankruptcy in 2008. And Japan was hit by the Great East Japan Earthquake of 2011. Only after these incidents can we finally discuss JapanÅfs economy on a more positive note these days. This report also touches on the various developments in the respective sectors of packaging during this period.
During the past ten years, the packaging industry and other related industries in this country have been grappling with Åg3RÅh (Reduce, Reuse, Recycle), of which special emphasis has been placed on Reduce. Attempts have been made at improving performance, downsizing, and addition of new functions. As a result, we now see great accomplishments in the reduction in packaging materials consumed and the prevalence of added values.
The data are presented in terms of 10-year transition, 5-year transition, comparison with 2001 data, year-on-year comparison, etc. We hope that you can foresee the future trends by quantitatively and objectively grasping the past trends in shipment statistics and also paying close attention to the details of data.
Also, in trying to shed light on the situations from various angles, we took care to include a broad array of data published by the related ministries, agencies, and organizations. We express our heartfelt appreciation to these public organizations for their generous cooperation. And, due to the nature of these listings, we must ask the readers of this report to forgive some inconsistency they might find in these data as to the choice of data sources, the scope of summation, and the like.
1. Survey Results and Review of Shipment Statistics
1.1 Scale and transition of JapanÅfs packaging industry
The totals of shipment value (sales) and volume representing the scale of JapanÅfs packaging industry in 2013 are as follows:
1.1.1 Shipment value (sales)
The shipment value (sales) kept declining from 1992 after the burst of bubble economy till 2003 before it turned upward in 2004 and kept rising for some time. However, after the Lehman Brothers bankruptcy in 2008, the shipment value underwent a steep decline and has remained sluggish all these years. In the aftermath of the Great East Japan Earthquake in 2011 and changes in economic conditions, the shipment value dropped slightly in 2012, but recovered to the pre-disaster level in 2013 (see Fig. 1). So the packaging industry is placing its hope on the data of next year (2015) which may reflect the effect of Abenomics.
Note that the shipment value of packaging materials and containers amounts to over 90% of the total shipment value of the packaging industry and it has shown similar tendencies over the past decade (see Fig. 2). The production value of the packaging machinery industry dropped to 86% of the 2007 peak after the bankruptcy of Lehman Brothers, but has steadily recovered ever since to 93% of the peak in 2013. It is about the same level at 92%, which is the current status of the packaging industry as a whole (see Fig. 4).
2,1.2 Shipping volume
In 2013, the shipping volume of packaging materials and containers increased 1.7% over the previous year, whereas the production volume of packaging machinery decreased 0.6% from the previous year. The shipping volume, too, has followed similar trends to those in the shipment value during the period of 2004 through 2013. It showed some signs of recovery after ten years from the collapse of bubble economy, but suffered setbacks from the economic downturn after the Lehman Brothers bankruptcy and the Great East Japan Earthquake of 2011. And so far the shipping volume has failed to achieve a full recovery (see Fig. 3). It should be noted, however, that the reduction in shipping volume has partly been caused by the industry-wide efforts at reducing the use of packaging materials.
Fig. 1 Shipment value (sales) of the packaging industry from 1989 to 2013
Fig. 2 Shipment value (sales) of packaging materials and containers from 1989 to 2013
Fig. 3 Shipping volume of packaging materials and containers from 1989 to 2013
Fig. 4 Production value (sales) of packaging machinery from 1989 to 2013
2.1.3 Shipment value and shipping volume
a) Ratio to GDP
There is a complex array of factors affecting the growth of the packaging industry as a whole. The basic factor is the vibrancy of national economy, especially the state of commodity distribution and commercial distribution connecting production and demand. Other major factors may include the demographic change and the changes in lifestyle, particularly those in eating habits. Also, the condition of export and import trade may significantly affect the packaging industry. To show the status quo of the industry, the ratio of its output to GDP (Gross Domestic Product) is often used as an overall parameter. Therefore the following statistics include data on the ratio of the production and shipment values to GDP in the past 10 years.
Note that the GDPs shown here are the second preliminary figures published by the Cabinet Office in March 2014.
Table 2.1.3.1 GDP and ratio of shipment value (sales) to GDP of packaging materials/containers
|
|
 |
During these 10 years, the ratio of the packaging industry shipment value to nominal GDP remained around 1.3%, whereas that to real GDP remained unchanged or was on a slightly downward trend. Since 2012, however, while the GDP showed a sign of an upward momentum, the shipment value (sales) has been sluggish at below 1.2% for two years consecutively.
b) ProducersÅf shipment index and price index
In order to compare the production of the packaging industry with that of the other industries in general, the data concerning packaging shown for reference below relate to the shipping volume by type of product, the shipping volume by type of producer, the industrial-production index, and the wholesale price index by product. A comparison between 2010 and 2013 shows increases in plastic materials and plastic products including those for applications other than packaging.
Table 2.1.3.2 Shipping volume by type of producer from 2009 to 2013
|
|
 |
|
| Source: Ministry of Economy, Trade and Industry Annual Report on Paper, Printed, Plastic, and Rubber Product Statistics |
Table 2.1.3.3 Shipping volume by type of producer from 2009 to 2013
|
|
 |
|
| Source: Ministry of Economy, Trade and Industry Annual Report on Paper, Printed, Plastic, and Rubber Product Statistics, Annual Report on Resources, Ceramics, Construction Materials Statistics |
Table 2.1.3.4 Industrial-production index (added value weighted) from 2008 to 2013
|
|
 |
|
| Source: Ministry of Economy, Trade and Industry Statistics: Industrial-Production Index |
Table 2.1.3.5 Wholesale price index by product from 2004 to 2013
|
|
 |
|
| Source: Bank of Japan Department of Research and Statistics: Price Index Monthly Report |
2.2 Composition of shipment value by type of material
Table 2 shows overall shipment values (sales) of packaging materials and containers from 2009 to 2013 classified into six material categories. The total shipment value of 2013 is ¥5,607.8 billion, and the ranking and the composition ratios of the types of material are as shown in Fig. 2.2.1.
Fig. 2.2.1 Composition of shipment value (sales) of packaging materials and containers in 2013 (%)
2.3 Composition of shipping volume by type of material
Table 3 shows overall shipping volumes of packaging materials and containers from 2009 to 2013 classified into six material categories. The total shipping volume of 2013 is 18,755,000 tons, and the ranking and the composition ratios of the types of material are as shown in Fig. 2.3.1.
The total shipping volume of 2004 was 21,057,000 tons. The ratio of paper and paper board has increased a little, whereas metal and glass have been on the decrease as with their shipment values. While the ratio of plastic did not show a significant change, the actual volume dropped from 4,000,000 tons to 3,500,000 tons. (See Fig. 2.3.4)
Fig. 2.3.1 Composition of shipping volume of packaging materials and containers in 2013 (%)
2.4 Shipment statistics of packaging machinery
Table 4 shows overall production values (sales) and volumes of packaging machinery from 2009 to 2013 classified into types of machines. The total production value in 2013 is ¥441.4 billion, and the ranking and the composition ratios of the types of machines are as shown in Fig. 2.4.1. The production value in 2004 was ¥450.11 billion, and there has been little change ever since. As for the composition ratios, individual and inner packaging machines rose, but outer packaging and packing machines declined.
Fig. 2.4.1 Composition of production value (sales) of packaging machinery in 2013 (%)
3. Shipment Values and Shipping Volumes
Table 1 Shipment value (sales) of packaging industry from 2009 to 2013
Table 2 Shipment value (sales) of packaging materials and containers from 2009 to 2013
Table 3 Shipping volume of packaging materials and containers from 2009 to 2013
Table 4 Production value (sales) and production volume of packaging machinery from 2009 to 2013
 |
|
| Note: | 1) The data of 1. Packaging & packing machines and 2. Bag-making machines represent annual (April to March) totals. 2) The volume and value data of 1. Packaging & packing machines and 2. Bag-making machines are planned values (actual values may be lower). |
4 Details of Shipment Statistics by Type of Material
4.1 Paper and paper board products
The shipment value of paper packaging materials and containers in 2013 is ¥2, 346.5 billion, the year-on-year rate being 103.2%, whereas the shipping volume of the year is 11,713,000 tons, the year-on-year rate being 102.5% (see Table 2, and Table 3). The breakdown of the shipping volume is 76% cardboard base paper, 10% paper vessel base paper, 11% packaging paper, wrapper and bag-making base paper, and 3% other.
4.1.1 Paper and board consumptions in the world
Table 4.1.1 below shows the paper and paper board consumption (incl. cardboard paper, paper vessel paper board, newsprint paper other than packaging paper, printing paper, and hygienic paper) by country and the world total.
The worldwide paper and board consumption was 401,400,000 tons (2012), registering 100.4% year-on-year. In terms of consumption by country, China ranked top, and Japan was third, following the USA. In the year-on-year growth rate, the USA, Japan, and European countries were on the decrease, but such Asian countries as China, India, Indonesia, and Thailand were on the increase.
Table 4.1.1 Paper and paper board consumption by country
|
|
 |
|
| Source: RISI Annual Review 2013 (Japan Paper Association) | |
| Note: Numbers in ( ) represent data from the Ministry of Economy, Trade and Industry,Å@the Chinese Paper Making Institute, the Korean Paper Association, and the Taiwanese Paper Making Institute. |
4.1.2 Per-capita paper and board consumption
Table 4.1.2.1 shows the per-capita paper consumptions in leading countries.
Belgium, Austria, Germany, the USA, and Japan were the top five countries in the per-capita consumption. China, which ranked top in the production volume of paper and paper board, did not rank within 20th in per-capita consumption.
Although the world average of per-capita consumption in 2012 was 57.2 kg, the per-capita consumption in Japan in that year was 4 times that level.
Table 4.1.2.1 Annual per-capita paper consumption by country
|
|
 |
|
| Source: RISI Annual Review 2013 (Japan Paper Association) | |
| Note: Numbers in ( ) represent data from the Ministry of Economy, Trade and Industry, the Korean Paper Association, and the Taiwanese Paper Making Institute. |
The per-capita consumption of paper and board in Japan, however, is on the decline. It is mainly due to the arrival of an information society where the use of networks such as the Internet is becoming widespread.
Table 4.1.2.2 Paper and paper board production volume and per-capita consumption
 |
| Per-capita consumption = net consumption (production + import - export) / population |
| Source: Ministry of Economy, Trade and Industry Annual Report on Paper and Pulp Statistics, Monthly Report on Paper, Printed, Plastic and Rubber Product Statistics, Ministry of Internal Affairs and Communications Bureau of Statistics: Estimated Population |
4.1.3 Production and shipping volume of paper and paper board
(1) Year-to-year changes in production volume and shipping volume
The following table shows the production volumes and domestic shipping volumes of paper and paper board. The production volume of paper and paper board in Japan was above 30 million tons in 2008, but dropped markedly in 2009 after the Lehman Brothers bankruptcy. Since then it has remained on the level of 26 million to 27 million tons without much increase. Especially in the area of paper, the printing and communication paper in particular showed a marked reduction on account of the dwindling birth rate, the aging population, the advance of networked environment, etc.
Table 4.1.3.1 Paper and paper board production and shipping volume
|
|
 |
|
| Source: Statistics on Paper, Printed, Plastic and Rubber Products | |
| Note: ÅgOtherÅh in the shipping volume covers the volumes of shipment within an enterprise, shipment for consignment production, or shipment for own use. |
(2) Production volume of paper and paper board by type of paper
The production volume of printing and communication paper in 2013 showed a significant drop at 0.85 compared with the 2008 level due to the influence of the networked information age. It does not show any recovery from the economic downturn after the Lehman Brothers bankruptcy in 2008.
The production volume in the area of packaging in 2013 showed a slight decline but a relatively steady trend, with the ratio to the 2008 level being 0.87 for packaging paper, 0.88 for paper vessel board, and 0.96 for cardboard base paper.
As for the breakdown of the total production volume of paper and paper board in 2013, cardboard accounts for 33.6%, paper vessel board 6.1% and packaging paper 3.4%.
Table 4.1.3.2 Production volume by type of paper
|
|
 |
|
| Source: Paper, Printed, Plastic and Rubber Product Statistics |
4.1.4 Export and import of paper and paper board
Table 4.1.4.1 shows the import and export volumes of paper and paper board (not incl. processed paper).
The import volume of paper and paper board had been increasing yearly until 2012, but suffered a fall in 2013.
The total import volume of paper and paper board in 2013 was 1,840,000 tons, 16.9% down from the previous year as a result of the reverse of the high yen value. The import volume of paper was 1,470,000 tons, 19.6% down from the previous year. The import of paper board was 370,000 tons, a 4.4% drop from the previous year. Whereas the import of cardboard base paper was 90,000 tons, 26.0% down from the previous year, the import volume of paper vessel board registered a two-year consecutive growth with an increase of 7.5%.
The total export volume of paper and paper board in 2013 was 1,060,000 tons, 31.7% up from the previous year. The exports of paper and paper board had remained at low levels due to priority placed on the supply to the domestic market after the Great East Japan Earthquake of 2011 and record high values of the yen, but began to increase as a result of the recovery of domestic supply capacity by the disaster-affected factories and the continuing depreciation of the yen. As the destinations of export of paper and paper board, such Asian countries as China, Malaysia, and Thailand accounted for 80% of the global market.
Table 4.1.4.1 Import and export of papers and paper boards
|
|
 |
|
| Source: Ministry of Finance Customs Clearance Statistics |
Processed paper is imported in addition to the imported paper and paper board. Table 4.1.4.2 shows the imports of PE-coated paper (milk carton), which is a representative processed paper imported to Japan.
Table 4.1.4.2 Import of milk carton paper
 |
| Source: Ministry of Finance Foreign Trade Statistics |
4.1.5 Heavy-duty kraft paper bags
Table 4.1.5 shows the shipping volumes by category of heavy-duty kraft paper bags as published by the Japan Kraft Paper Sack Association.
Table 4.1.5 Shipping volume by category of kraft paper bag industry in 2001 and past 3 years (2011-2013)
| First line: Number of paper bags (1,000 units), Second line: Volume of base paper (1,000 tons) |
 |
| Source: Japan Kraft Paper Sack Association |
4.1.6 Cardboard (corrugated fiberboard)
The production volume of double-faced cardboard, whose composition ratio had been increasing yearly, accounted for 89.2% of the total cardboard production in Japan in 2013. On the other hand, the production of double wall cardboard had been decreasing yearly, and the composition ratio in 2013 was 9.6%. The reduction in double wall cardboard is nearly equal to the increase in double-faced cardboard. The possible cause may be the ongoing improvement in the material used in cardboard packaging such as the replacement of double wall cardboard by double-faced cardboard in some applications and the use of double-faced cardboard containing reinforced core material.
Table 4.1.6.1 Production volume by type of cardboard
 |
| Source: Ministry of Economy, Trade and Industry Annual Report on Paper, Printed, Plastic, and Rubber Product Statistics |
The production volume of cardboard is about 13.45 billion m2. It showed a marked drop temporarily in 2009, but recovered nearly to the former level in 2013. While the consumption (input to subsequent processes) has been slightly on the increase, the sheet shipment has remained substantially level.
Table 4.1.6.2 Production, consumption, and shipping volume of cardboard
 |
| Source: Japan Corrugated Case Association |
Inputs for box-making by sector of demand represent the breakdown of consumptions (input to subsequent processes). It is to be noted that about 40% of sheets as they are sold are processed into cardboard boxes, but this part is not included in the data.
The cardboard products are the articles most widely used among packaging materials and containers. Their use is characterized in that (1) the cardboard is more frequently used in replacement of plastic shock absorbers or wooden frames (for electrical products and mechanical parts), (2) they are used in commercial packaging in mail order, home delivery, and the like, and (3) they are used in packaging of fruit, vegetables, and processed food.
Among the inputs for box-making by sector of demand, those for the articles of food showed the greatest composition ratio at about 57% of the total. The increasing use of cardboard for mail order, home delivery, and move was notable, although the composition ratio was only 4%.
Table 4.1.6.3 Consumption by demand sector of cardboard (input to box-making)
 |
| Source: Japan Corrugated Case Association |
4.1.7 Used paper recovery amount and recovery rate by country and used paper utilization rate in Japan
Table 4.1.7.1 shows the recovery amount and recovery rate of used paper in leading countries (2010 and 2011). Table 4.1.7.2 shows the recovery amount and recovery rate of used paper in Japan (2010 and 2011), and Table 4.1.7.3 the utilization rate of used paper in Japan. a) Used paper recovery amount by country The top five countries in the recovery amount of used paper are the USA, China, Japan, Germany, and South Korea. The total of used paper recovery amount in the world is 228,126,000 tons (2011). The composition ratios of the countries are 21% the USA, 19% China, 9% Japan, 7% Germany, and 4% South Korea, and the USA and China together account for 40% of the total. Note that the recovery rates of South Korea (98%), Japan (78%), and Germany (77%) exceed those of the USA (66%) and China (45%).Table 4.1.7.1 Recovery of used paper by country
 |
| Source: RISI Annual Review 2012 |
| Note: Numbers for the countries with Åg * Åh represent data from the Ministry of Economy, Trade and Industry, the Chinese Paper Making Institute, the Korean Paper Association, and the Taiwanese Paper Making Institute. |
b) Used paper recovery amount and recovery rate in Japan
The consumption of paper and paper board in Japan had been about 30 million tons until 2008. It dropped after the Lehman Brothers bankruptcy and has so far failed to make a recovery. On the other hand, the recovery rate of used paper has kept increasing.
Japan has advanced used paper recovery systems including separate collection by municipalities, group recovery by neighborhood communities, and storefront recovery, which shore up the rising recovery rate. Japan is therefore an advanced recycling country with its used paper utilization rate and recovery rate ranking among the highest in the world.
Table 4.1.7.2 Paper and paper board consumption and used paper recovery amount and recovery rate in Japan
 |
| Used paper recovery rate = used paper recovery amount / consumption in Japan Å~ 100 Ministry of Economy, Trade and Industry Annual Report on Paper and Pulp Statistics, Ministry of Finance Monthly Report on Japanese Trade Source: Paper Recycling Promotion Center |
c) Used paper utilization rate in Japan
Table 4.1.7.3 shows the utilization rate of used paper in Japan. In the table, the values in the ÅgpaperÅh column represent the rates at which used paper is used in paper production, whereas the values in the Ågpaper boardÅh column represent the rates at which used paper is used in paper board production. The values in the ÅgtotalÅh column represent the rates at which used paper is used in the paper and paper board production.
The used paper utilization rate for paper and board as a whole has been increasing gradually. The used paper utilization rate for the total of paper and paper board production in 2012 was 63.7%, up 0.7 points from 63% of 2011.
The utilization rate of used paper for paper board production in 2012 was 92.9%, but that for paper production remained at 41%. Since the main applications of used paper for paper production are printing and communication paper and newsprint paper, only a limited kind of used paper, namely, high-quality used paper (newspaper, office paper, some magazines, etc.) must be selected. On the other hand, magazines, cardboard, crude paper, Japanese vellum, and the like can be used as used paper for paper board production, thus making the utilization rate high.
For further improvement in used paper utilization rate, it is considered necessary to increase the recovery amount of high-quality used paper by employing better recovery methods.
Table 4.1.7.3 Used paper utilization rate in Japan
 |
| Used paper utilization rate = used paper consumption total / paper-making fiber material consumption total (used paper + used paper pulp + pulp + other fiber) Å~ 100 Ministry of Economy, Trade and Industry Annual Report on Paper and Pulp Statistics, Ministry of Finance Monthly Report on Japanese Trade Reference: Paper Recycling Promotion Center |
Table 4.1.7.4 Used paper recovery rate and utilization rate in Japan
 |
| Used paper utilization rate = used paper consumption total / paper-making fiber material consumption total (used paper + used paper pulp + pulp + other fiber) Å~ 100 Ministry of Economy, Trade and Industry Annual Report on Paper and Pulp Statistics, Ministry of Finance Monthly Report on Japanese Trade Source: Paper Recycling Promotion Center |
Fig. 4.1.7.1 is a graph showing a relationship between used paper recovery rate and used paper utilization rate in Japan. The used paper recovery rate and the used paper utilization rate had followed similar growth trajectories until 2000, but after that the recovery rate rose at faster rates than the utilization rate. The surplus of used paper for paper and board production has been diverted for exports.
Fig. 4.1.7.1 Used paper recovery rate and utilization rate in Japan
In 2000, the exports of used paper overtook the imports and kept rising since then. The exports in 2013 were 4,889,715 tons, which exceeded by a large margin the imports at 30,076 tons.
 |
| Source: Ministry of Finance Monthly Report on Japanese Trade |
Fig. 4.1.7.2 Used paper export and import
4.1.8 Recovery rate of cardboard
Table 4.1.8 shows the recovery rate of cardboard (corrugated fiberboard) in Japan. The cardboard items exiting factories and distribution outlets are recovered directly, and those discharged from homes are gathered in resource recovery together with newspapers and magazines. As a result, the recovery rate exceeds the consumption in Japan. A main reason for the recovery rate in excess of 100% is because the data includes the recovery of the cardboard boxes for imported products.
Table 4.1.8 Cardboard recovery rate
 |
| Recovery rate = recovery amount in Japan ÅÄ consumption in Japan Å~ 100 Source: Paper Recycling Promotion Center |
4.2 Plastic products
The shipping volume of plastic products to satisfy the demand for packaging materials and containers in 2013 was about 3,510,000 tons, and the shipment value was estimated at ¥1,663.9 billion. Their year-on-year data were 101.3%, an increase of 45,000 tons, and 102.3%, an increase of ¥37.9 billion, respectively.
Of the total shipping volume of plastic packaging materials and containers in 2013, the film and sheet accounted for 48.8%, the blow-molded container 23.4%, the injection-molded container 9.7%, the laminated soft product 8.8%, the foamed product 6.7%, the extrusion-molded product 1.6%, and the oriented flat yarn 1.1%. The blow-molded container increased 0.8% from 22.6% of the previous year.
Table 4.2.2.1 shows the shipment value (sales) and shipping volume of plastic products.
4.2.1 Packaging demand for plastic materials
The shipping volume of plastic packaging materials and containers in 2013, which is about 3,510,000 tons, accounts for 33% (0% increase year-on-year) of the production volume of 10,580,000 tons (10,520,000 tons in 2012) of plastic materials (thermoplastic resins) (source: Japan Plastics Industry Federation Monthly Report on Economy and Industry Statistics). Table 4.2.1 shows the production volume of plastic materials and the shipping volume of plastic packaging materials and containers. For over the past dozen years, the ratio of plastic packaging materials and containers to the plastic materials (thermoplastic resins) has been stable at around 30%.
Table 4.2.1 Production volume of plastic materials and shipping volume of plastic packaging materials and containers
|
|
 |
|
| Source: Japan Plastics Industry Federation, Japan Packaging Institute |
4.2.2 Export and import of plastics in 2013
According to a survey report by the Japan Plastics Industry Federation, the export of plastic materials decreased 0.6% from the previous year, and that of plastic products 1.0% from the previous year. However, the import of plastic materials increased 0.5% over the previous year, and that of plastic products 2.6% over the previous year. Table 4.2.2.1 and Table 4.2.2.2 show the excerpts from related data of detailed statistics on packaging in the report.
Also, since the original materials used for packaging materials are mostly thermoplastic resins, the data presented here is that of thermoplastic resins only. Note that the imported boards, sheets, hot-stamped films, tapes, and the like, which are treated as plastic products, are excluded from our data because they are processed into packaging materials as part of the domestic production and shipping volume.
Table 4.2.2.1 Shipment value (sales) and volume of plastic products (incl, oriented flat yarn, binding tape, and band)
|
|
 |
|
| Source: Japan packaging Institute |
Table 4.2.2.2 Import and export of plastic materials and plastic products
|
|
 |
|
| Source: Japan Plastics Industry Federation |
4.2.3 Shipment of polyethylene film
Table 4.2.3.1 Shipments of polyolefin film from 2008 to 2013
 |
| Reference: Japan Polyolefin Film Industry Trade Association |
Table 4.2.3.1 shows the statistics provided by the Japan Polyolefin Film Industry Trade Association on the shipments of polyolefin film from 2008 to 2013. In 2013, the total of LDPE film, HDPE film, and IPP film shipments was 522,000 tons, down to 99.6% of the previous year. It represented a slight declining tendency having continued since 2008, although it was not a conspicuous plunge as in 2009.
Table 4.2.3.2 Import and export volume and value of ethylene polymer bags among transport and packaging products and accessories
|
|
 |
|
| Source: Japan Plastics Industry Federation |
In contrast to this, as shown in Table 4.2.3.2, the imports of ethylene polymer bags were 94 times the exports (505,125 tons / 5,390 tons) in 2011 and 97 times the exports (521,783 tons / 5,376 tons) in 2012. While the imports have been increasing since 1999, the exports had been on the increase from 1999 to 2007, but have been on a downward trend after the peak in 2007.
Table 4.2.3.3 Imports of polyethylene bags from 2009 to 2013
|
|
 |
|
| Source: Ministry of Finance Statistics |
4.2.4 Shipment of polypropylene film
Table 4.2.4 shows the statistics provided by the Japan Polypropylene Film Industry Association on the shipments of polypropylene film by sector of demand. In 2013, the total shipment of OPP (stretched) film was 226,000 tons, an increase of 2.1% from the previous year. By sector of demand, the demand for OPP film for food applications accounted for 76% of the total and showed an increase of 3.1% over the previous year. The export also increased 4.7% from the previous year. The other sectors, however, showed negative growths.
The shipment of CPP (non-stretched) film increased 3.1% over the previous year to 155,000 tons. By sector of demand, the demand for CPP film for food applications accounted for 79% of the total. And all the demand sectors showed increases over the previous year.
Table 4.2.4 Shipments of polypropylene film
 |
| Source: Japan Polypropylene Film Industry Association |
4.2.5 Shipments by application of polystyrene (GP/HIPS)
Table 4.2.5 shows the shipments of polystyrene for domestic demands according to a survey by the Japan Petrochemical Industry Association. In 2012, the composition ratio of packaging use was on the increase at 48.1%, but the year-on-year data represented a decrease of 1.6%, evidencing a declining trend for the past several years.
Table 4.2.5 Shipments by application of PS (GP/HIPS)
|
|
 |
|
| Source: Japan Petrochemical Industry Association |
4.2.6Å@Shipment of blow-molded containers
Table 4.2.6 shows the production and shipment volumes of blow-molded containers. The shipping volume of blow-molded containers as a whole had been decreasing until 2011. But since 2012 the blow-molded containers of polyethylene terephthalate (PET) forged ahead and are on the increase while those of other plastics remained stagnant.
Table 4.2.6 Production and shipment volumes of blow-molded containers
|
|
 |
|
| Source: Japan Packaging Institute |
4.3 Metal products
Of the metal packaging materials and containers in 2013, the shipment value (sales) was ¥944.6 billion and the shipping volume was 1,625, 000 tons, the year-on-year rates rising slightly to 100.8% and 100.6%, respectively.
The shipment value has dropped gradually from ¥1,091.3 billion in 2002 to ¥944.6 billion in 2013, representing a reduction to 87% during the ten-year period. The ratios of steel and aluminum have remained about the same at 42 to 46%. Their shipping volumes have also been on the decrease, a drop to 75% over the ten years. It is found that this is more due to the reduction in the use of steel materials.
4.3.1 Consumption of aluminum cans
Fig. 4.3.1.1 shows the annual consumptions of aluminum cans. In 2013, the consumption volume is 19,396 million units, and the consumption weight 303,830 tons. Both the consumption volume and weight have remained nearly constant during the period from 2004 to 2013.
Table 4.3.1 shows the details of demand for beverage aluminum cans in Japan in 2012. The imports of empty cans were quite meager at 0.2% of the total. Also, the imports of filled cans, which have shown a marked increase recently, are still as low as about 4% of the total. Yet, the future trend must be watched carefully since the year-on-year rate of 130% is markedly high compared with others.
Fig. 4.3.1.1 Consumption of aluminum cans
Table 4.3.1 Demand for beverage aluminum cans in Japan
|
|
 |
|
| Reference: Japan Aluminum Can Recycling Association |
4.3.2 Production of steel cans
Table 4.3.2 hows the production volumes of steel beverage cans and food cans. From 2002 to 2012, the beverage cans had reduced yearly from 15,824 million cans to 11,204 million cans, a drop to 71%, whereas the food cans had reduced yearly from 1,317 million cans to 898 million cans, a drop to 68%.
Table 4.3.2Å@ Production volume of steel beverage cans and food cans
4.4 Glass products
The annual consumption of glass products in 2013 was such that the shipment value (sales) was ¥124.7 billion and the shipping volume 1,262,000 tons, the year-on-year rates decreasing to 98.9% and 98.1%, respectively.
The shipment value (see Fig. 4.4.1) has dropped gradually from ¥166.2 billion in 2002 to ¥124.7 billion in 2013, representing a reduction to 75% during the ten-year period. The shipping volume (see Fig. 4.4.2) has also been on the decrease, a drop to 75% from 1,685,000 tons to 1,262,000 tons over the ten years. The cosmetics bottles, with their shipping volume being 1% and the shipment value being 6% of the total, are items featuring high added values.
Fig. 4.4.1 Shipment value (sales) of glass products
Fig. 4.4.2 Shipping volume of glass products
Table 4.4.3 Shipments of glass bottles
|
|
 |
4.5 Pallets
The total annual production of pallets in Japan (estimated by the Japan Pallet Association) in 2013 was 63.3million units, down to 94.8% of the previous year. Classified by the type of material used, four types, namely, wood pallets, plastic pallets, sheet and paper pallets (fiberboard, cardboard), and metal pallets (steel, aluminum), were mainstream, and their composite materials were also in use.
Regarding the composition ratios of different types of pallets, the production of wood pallets was the highest at 65.1%, but the ratio dropped three years consecutively since 2011. The production of plastic pallets followed this at 17.4%, and all the others showed the ratios of slightly above 3%. Of metal pallets, although there has been a tendency to avoid aluminum pallets because of their high prices, aluminum pallets are gaining a growing recognition because of their lightweight and corrosion resistance (long service life and environment-friendly), hygienic property (GMP superiority), and reusability and recyclability as with plastic pallets.
In recent years, the importance of quality and hygiene management has been stressed in the production and commodity distribution processes of wide areas covering food, drugs and medicines, cosmetics, and other industrial products. For example, GMP has been introduced to the pharmaceutical industry, and HACCP (Hazard Analysis and Critical Control Points) has been introduced to the food industry after the enactment of the Product Liability Act. In addition to these, ISO certification as the global standard of quality has been incorporated into the production processes, thus establishing standardized quality and hygiene management in this country.
However, in order to assure the company-wide quality and hygiene management with willing participation by all the staff and workers, the quality and hygiene management systems must also be structured for such entrance processes as procurement of materials and parts for production and for such exit processes as shipment and distribution of products. In this sense, the importance of transportation hygiene management is already recognized, and we see the widening use of rental pallets complete with cleaning service of pallets and containers. As shown in Table 4.5.2, the total of rental pallets has been increasing yearly, chalking up a record-high 20,090,000 units in 2013, up about 60% over the 12,520,000 units in 2011.
Table 4.5.1 Pallet production volumes and composition rates
 |
| Source: Japan Pallet Association |
Table 4.5.2 Quantities of rental pallets
|
|
 |
|
| Source: Japan Pallet Association |